
China residential construction starts slower: Gerard Burg
GUEST OBSERVER
There was little change in most of China’s key monthly indicators in May. ‘Old economy’ measures, such as industrial production and fixed asset investment were flat or slightly higher (in real terms), while real retail sales were marginally weaker.
As we suggested last month, these indicators suggest slightly softer economic conditions in Q2, compared with the relatively strong rate in Q1. Our forecasts remain unchanged, with China’s economy to grow by 6.5% in 2017, before slowing to 6.25% next year and 6.0% in 2019.
China’s industrial production grew by 6.5% yoy in May – unchanged from the rate recorded in April. Construction related heavy industrial sectors (such as crude steel and cement ) saw much weaker growth.
China’s fixed asset investment recorded slightly weaker growth in May – at around 7.9% yoy (from 8.3% in April). That said, weaker inflation trends for investment goods meant that real fixed asset investment was slightly higher (1.5% in May, up from 0.9% in April). Real estate investment has remained comparatively strong, however we continue to anticipate a slowdown in construction activity this year – given tighter financial and policy constraints – which should flow through to industrial production and demand for Australian commodity exports.
China’s trade balance edged slightly higher in May – to US$40.8 billion (from US$38.0 billion in April). Both imports and exports were higher month-on-month (with the increase in exports stronger). Commodity prices have had a major impact on import values (and likely export values as well given producer price trends) – with values likely to slow across the second half of the year – in line with weaker commodity price forecasts.
Growth in retail sales was unchanged in May – with nominal sales rising by 10.7% yoy. The uptick in inflation during the month meant that real retail sales were slightly weaker – albeit stronger than the growth across most of 2016. Consumer confidence pushed higher in April – up to 113.4 points (the highest level recorded since June 2007).
Chinese monetary policy remained comparatively stable in across May and early June – with the 7 day Shibor trading in a narrow range of just under 9 basis points around the 2.9% mark. This represents around 40 basis points of tightening since the start of the year. Our monetary policy views are unchanged – we believe that the PBoC has a tightening bias, but will be cautious in doing so, in an attempt to manage the risks associated with the country’s high corporate debt levels.
China’s industrial production grew by 6.5% yoy in May – unchanged from the rate recorded in April. This was stronger than market expectations (6.4% in the Bloomberg poll and 6.3% in the Thomson Reuters poll) and higher than the trend seen across much of the past two years.

Construction related heavy industrial sectors saw much weaker growth – with crude steel output rising by just 1.8% yoy to 72.3 million tonnes (down from record production levels in April), while cement production rose by just 0.5% yoy.
In contrast, motor vehicle production was stronger – up by 4.1% yoy in May (compared with 0.3% in April), while growth in electricity output eased to 5.0% yoy (from 5.4% previously).
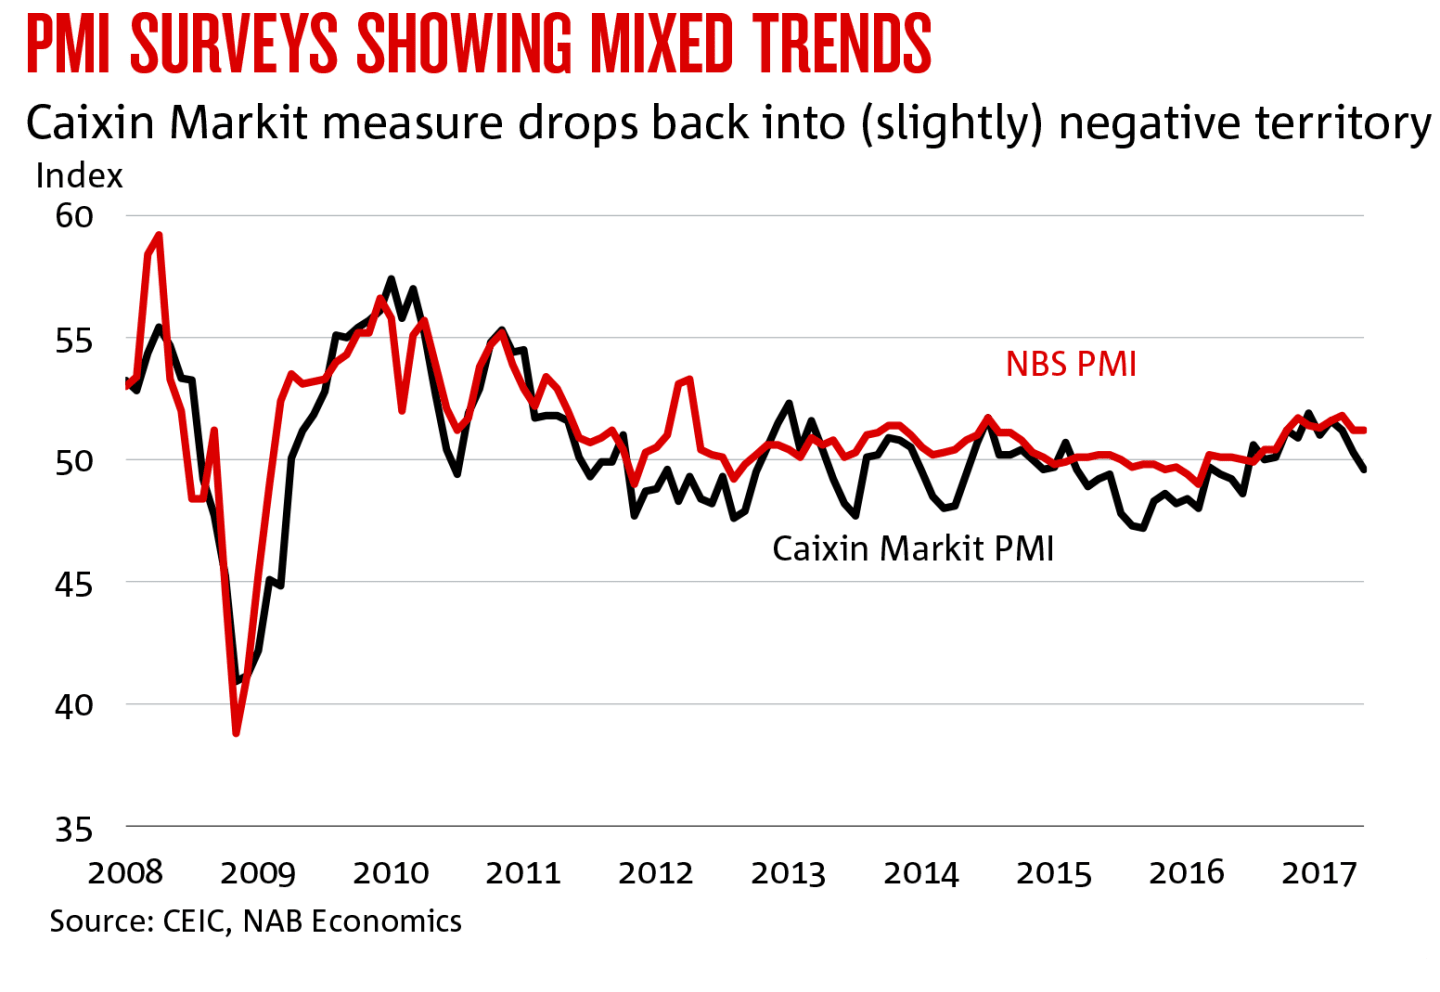
There were mixed trends in China’s main industrial surveys in May. The official NBS PMI survey was unchanged at 51.2 points. In contrast, the Caixin Markit PMI fell further – down to a slightly negative 49.6 points (from 50.3 points in April).
China’s fixed asset investment recorded slightly weaker growth in May – at around 7.9% yoy (from 8.3% in April). That said, the decline in prices for investment goods probably outpaced the fall in nominal investment – given recent trends in producer prices and commodity markets – meaning that real fixed asset investment has trended slightly higher. Our estimate suggests real investment grew by 1.5% in May, up from 0.9% in April.

Private sector investment edged slightly higher in May – rising by 6.6% yoy(on a three month moving average basis) – albeit this remains below the growth rate of early 2016 (prior to the plunge mid-year). In contrast, investment by state owned enterprises dipped to 12.2% yoy (3mma), from 13.7% previously.
Despite measures designed to cool the sector, investment in real estate has continued to grow strongly – rising by 8.8% yoy (3mma) in May – down from 9.3% last month. Manufacturing investment was slightly stronger – at 5.3% yoy (3mma) from 4.8% previously.
Efforts by authorities at central and local levels to control property prices (including larger down payments, higher lending rates and purchasing restrictions) are yet to show widespread results. Month-on-month prices rose by 0.5% for new builds and 0.7% for existing properties in April (both stronger than March) according to NBS data. That said, unofficial data for May (released by the Chinese Academy of Social Sciences) suggests that prices in some key cities – including Beijing and Tianjin – may have fallen in May.
New residential construction starts recorded weaker growth in May – at 8.4% yoy (down from 16.6% in April) – although it is unclear if this a slowing trend or merely volatility in the data. On a three month moving average basis, the slowdown was less pronounced – at 15.1% yoy (down from 17.5%). We continue to anticipate a slowdown in construction activity this year – given tighter financial and policy constraints – which should flow through industrial production and demand for Australian commodity exports.

China’s trade balance edged slightly higher in May – to US$40.8 billion (from US$38.0 billion in April). Both imports and exports were higher month-on-month (with the increase in exports stronger).
China’s imports were stronger in May – at US$150.2 billion (compared with US$142 billion in April) – with this representing a year-on-year increase of 14.6%. This increase was in part driven by commodity price trends – with the RBA Index of Commodity Prices increasing by 29% yoy in May. This means that import values are likely to slow across the second half of the year – in line with forecasts of weaker commodity price growth.

In contrast, the overall volume of imports has increased more modestly. While import values have risen by around 19% in the first five months of the year, our estimate of volumes is just 6.4% higher.
Trends continue to diverge when it comes to the import volumes of key commodities. Coal imports recorded strong year-on-year growth – at almost 17% – although the May level was 18% below last November’s peak. The surge in coal imports – particularly across the second half of last year – was driven by government policy that constrained domestic supply, and there remains considerable uncertainty around the longer term – with both domestic demand and supply falling (the latter through enforced mine closures).
Crude oil imports rose by 15% yoy in May, while iron ore imports rose by 5.5% yoy – despite iron ore stocks reaching record levels in May (while prices for ore continued to fall). Copper imports fell by 9.3% yoy – a trend evident for the past nine months.
The value of China’s exports rose in May – totalling US$191.0 billion (from US$180 billion in March) – an increase of 8.7% yoy.

The confidence of exporters has remained relatively flat in recent months – despite the uptick in export values – with the new export orders measure in the NBS PMI survey at 50.7 points in May (up from 50.6 points previously) – below the near five year high of 51.0 points in March.
Exports to China’s major trading partners continue to show diverging trends. There was strong growth for the United States – up by 11.7% yoy – and the European Union (9.7% yoy), while exports to other East Asian markets fell by 2.0% yoy.
This result continues to be influenced by the historic distortion in Hong Kong-China trade data. Exports to non-Hong Kong Asia rose by 4.1% yoy in May – led by increases in trade with South Korea, Vietnam and Indonesia – while exports to Hong Kong fell by 10.6% yoy.
So far this year, there has been a close correlation between the trade values reported by both China and Hong Kong customs – for the first time since 2010. In the first four months of 2017, the total difference between the two totalled RMB 1.9 million, compared with RMB 13.7 billion in the same period of 2016, RMB 12 billion in 2015 and RMB 24.6 billion in 2014. In part this discrepancy reflected capital outflows disguised as trade activity – through methods such as false invoicing – something that Chinese authorities have clamped down on more recently.
That said, the overstated historical exports paints a more negative view on current trade data. While Chinese data suggests that exports to Hong Kong fell by over 15% yoy in April, Hong Kong customs data recorded an increase of 4.3% yoy.
Growth in retail sales was unchanged in May – with nominal sales rising by 10.7% yoy. The uptick in inflation (see below) during the month meant that real retail sales were slightly weaker – at around 9.4% yoy (down from 9.7% previously) – although this rate was stronger than the growth recorded across most of 2016.

Despite real sales dipping below 10% last month, consumer confidence pushed higher in April – up to 113.4 points (the highest level recorded since June 2007).
China’s headline inflation edged slightly higher in May – with the Consumer Price Index pushing up to 1.5% yoy (from 1.2% in April).
Food prices have continued to contract – contributing to the recent weakness in inflation trends. Aggregate food prices fell by 1.6% yoy in May (compared with 3.5% in April and 4.4% in March). Prices for meat & poultry, eggs and fresh vegetables fell year-on-year – albeit vegetables decline was smaller in May – at 6.3% yoy versus 22% in April.
In contrast, the stronger trend for non-food prices has continued, with the index rising by 2.3% yoy in May (compared with 2.4% in April) – more than double the rate recorded a year ago. Fuel prices have been a major contributor, with double digit growth for the past six months (10.2% yoy in May).

The acceleration in producer prices has already started to slow – with the producer price index increasing by 5.5% yoy in May (down from 6.4% previously). Commodity prices flowing through the industrial sector has a major influence – with growth in the RBA Index of Commodity Prices slowing to 29% yoy in May (compared with 36% in April). The overall index is below late 2016 peaks and has trended lower, meaning that producer price growth is likely to be less significant in coming months.
Credit issuance data was not available at the time of writing.
Chinese monetary policy remained comparatively stable in across May and early June – with the 7 day Shibor trading in a narrow range of just under 9 basis points around the 2.9% mark. This represents around 40 basis points of tightening since the start of the year.

The People’s Bank of China (PBoC) kept the rates for the Standing Lending Facility, Medium Term Lending Facility and 7 day reverse repos on hold during the past month, while it marginally increased liquidity in May (via open market operations) – by around RMB 20 billion (compared with RMB 210 billion in April).
Our monetary policy views are unchanged – we believe that the PBoC has a tightening bias, but will be cautious in doing so, in an attempt to manage the risks associated with the country’s high corporate debt levels.
Gerard Burg is a Senior Economist - Asia at NAB Group Economics